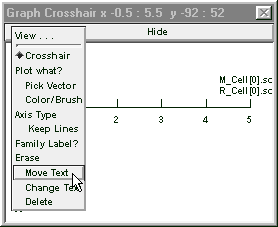

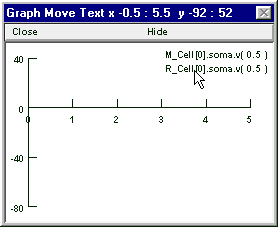
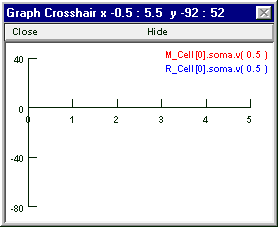
Left click on a label and hold the mouse button down . . .
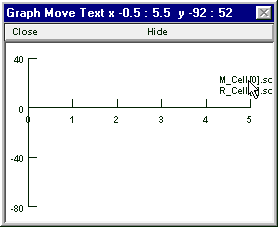
. . . while dragging the cursor to a new position.
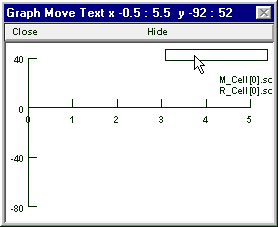
Release the curor and the label reappears in the new location.
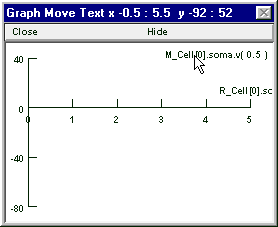
Repeat for the other label.
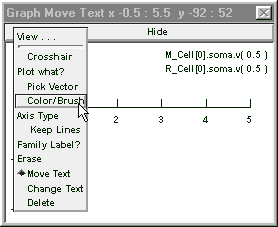
This pops up a color & linestyle palette. Click on the radio button next to the red line in the left column.
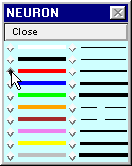
Click on one label and note the change in color.
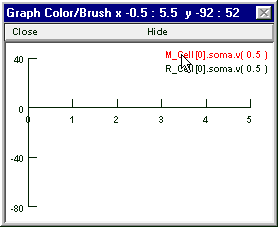
Go back to the palette and select blue. Then click on the other label. When you're done, restore Crosshair mode!
Copyright © 2001 by N.T. Carnevale and M.L. Hines, All Rights Reserved.